What is the teamecho benchmark?
As an administrator you have the possibility to compare your own mood index with the teamecho benchmark. Here you can find a small overview of our teamecho benchmark.
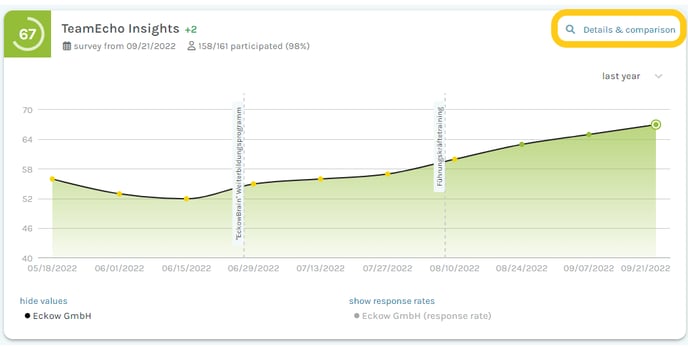
As an administrator, you have the option to display the teamecho benchmark on your dashboards. Select the option "Details & Comparison" in the upper right corner of the satisfaction index on your dashboard:

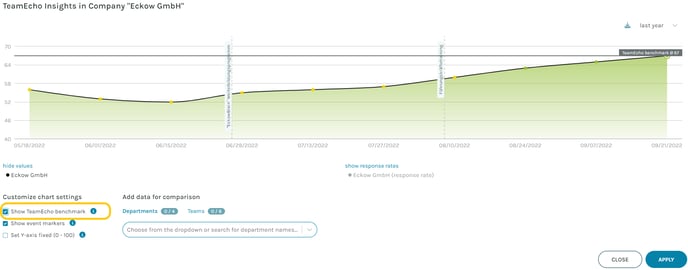
In the detail view you can activate the option "Show teamecho benchmark" in the lower left corner of "Customize chart settings" - now the current benchmark is displayed in the chart:

Please note: The teamecho benchmark & industry benchmark is only available for teamecho standard question sets (teamecho Insights). If you use an individual question set (have made changes to the standard question set), this option is not available.
What is the composition of the teamecho benchmark?
The teamecho benchmark is the average of all teamecho surveys of the respective question set. The data basis is a balanced mix of different industries and corporate cultures.
How can I view the industry benchmark in the tool?
The industry affiliation can be adjusted in the company data.
Once at least five companies from the same industry are recorded in the tool, the corresponding industry benchmark will become visible.
Much more important than the external comparison with the teamecho benchmark is the observation of your own development. Therefore, observe your own results carefully and focus your interpretation more on internal changes.
Click here for more Information on gaining success with teamecho.